Welcome to Santa Cruz Biotechnology!

normal mouse IgG1-PE: sc-2866

(Based on popularity)

  • sufficient for 100 tests
  • phycoerythrin conjugated
  • affinity purified immunoglobulin
  • for use as negative controls for flow cytometry
  • See 1 citations for normal mouse IgG1-PE
 
Product Citations
Set Currency

 Ordering Information
Product NameCatalog #UnitPriceQtyAdd 
normal mouse IgG1-PE sc-2866 100 tests in 2 ml $38
normal mouse IgG1-PE Product Citations
See how others have used normal mouse IgG1-PE.


1 total citations
Loading citations.
 
normal mouse IgG1-PE Data
Click on image to enlarge
NOS2 (C-11) PE: sc-7271 PE. Intracellular FCM analysis of methanol permeabilized RAW 264.7 + LPS/IFNγ cells. Solid black line histogram represents the isotype control, normal mouse IgG1: sc-2866.
NCAM (ERIC 1) PE: sc-106 PE. FCM analysis of SHP-77 cells. Black line histogram represents the isotype control, normal mouse IgG1: sc-2866.
NCAM (123C3) PE: sc-7326 PE. FCM analysis of SHP-77 cells. Black line histogram represents the isotype control, normal mouse IgG1: sc-2866.
Bax (2D2) PE: sc-20067 PE. Intracellular FCM analysis of fixed and permeabilized BJAB cells. Black line histogram represents the isotype control, normal mouse IgG1: sc-2866.
Rb (IF8) PE: sc-102 PE. Intracellular FCM analysis of fixed and permeabilized K-562 cells. Black line histogram represents the isotype control, normal mouse IgG1: sc-2866.
Ku-86 (B-1) PE: sc-5280 PE. Intracellular FCM analysis of fixed and permeabilized A-431 cells. Black line histogram represents the isotype control, normal mouse IgG1: sc-2866.
TRAF2 (H-10) PE: sc-7346 PE. Intracellular FCM analysis of fixed and permeabilized human peripheral blood leukocytes. Black line histogram represents the isotype control, normal mouse IgG1: sc-2866.
IL-3/IL-5/GM-CSFRβ (1C1) PE: sc-21765 PE. FCM analysis of control (dotted pink histogram) and GM-CSFRβ transfected (solid orange histogram) CHO cells. Blue line histogram represents the isotype control, normal mouse IgG1: sc-2866.
p27 (F-8) PE: sc-1641 PE. Intracellular FCM analysis of fixed and permeabilized KNRK cells. Black line histogram represents the isotype control, normal mouse IgG1: sc-2866.
ICAM-3 (3.1) PE: sc-9971 PE. FCM analysis of Jurkat cells. Black line histogram represents the isotype control, normal mouse IgG1: sc-2866.
CD32 (AT10) PE: sc-13527 PE. FCM analysis of THP-1 cells. Black line histogram represents the isotype control, normal mouse IgG1: sc-2866.
CD33 (WM-54) PE: sc-18844 PE. FCM analysis of THP-1 cells. Black line histogram represents the isotype control, normal mouse IgG1: sc-2866.
CD45 (T29/33) PE: sc-18901 PE. FCM analysis of Jurkat cells. Black line histogram represents the isotype control, normal mouse IgG1: sc-2866.
TLR2 (11G7) PE: sc-47728 PE. FCM analysis of THP-1 cells. Black line histogram represents the isotype control, normal mouse IgG1: sc-2866.
CD33 (WM53) PE: sc-51725 PE. FCM analysis of THP-1 cells. Black line histogram represents the isotype control, normal mouse IgG1: sc-2866.
HLA-DRβ (DA2) PE: sc-53314 PE. FCM analysis of Raji cells. Black line histogram represents the isotype control, normal mouse IgG1: sc-2866.
HLA-DRβ (TDR 31.1) PE: sc-53321 PE. FCM analysis of Raji cells. Black line histogram represents the isotype control, normal mouse IgG1: sc-2866.
ICAM-3 (By44) PE: sc-53337 PE. FCM analysis of Jurkat cells. Black line histogram represents the isotype control, normal mouse IgG1: sc-2866.
CD13 (BR2) PE: sc-53970 PE. FCM analysis of THP-1 cells. Black line histogram represents the isotype control, normal mouse IgG1: sc-2866.
CD71 (PA-1) PE: sc-69737 PE. FCM analysis of Jurkat cells. Black line histogram represents the isotype control, normal mouse IgG1: sc-2866.
PTH/PTHrP-R (3D1.1) PE: sc-12722 PE. FCM analysis of human peripheral blood leukocytes. Black line histogram represents the isotype control, normal mouse IgG1: sc-2866.
CLIP (cerCLIP.1) PE: sc-12725 PE. FCM analysis of T2DR3 cells. Quadrant markers were set based on the isotype control, normal mouse IgG1: sc-2866.
CD9 (MZ3) PE: sc-13541 PE. FCM analysis of mouse peripheral blood leukocytes. Quadrant markers were set based on the isotype control, normal mouse IgG1: sc-2866.
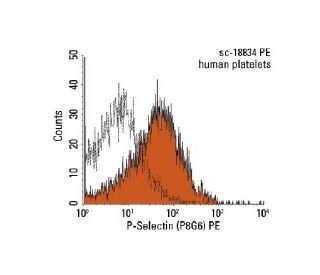
P-Selectin (P8G6) PE: sc-18834 PE. FCM analysis of human platelets. Black line histogram represents the isotype control, normal mouse IgG1: sc-2866.
IL-2Rα (BC96) PE: sc-19628 PE. FCM analysis of PMA-stimulated human peripheral blood leukocytes stained with IL-2Rα (BC96) PE and CD4 (MT310) FITC: sc-19641 FITC. Quadrant markers were set based on the isotype controls, normal mouse IgG1: sc-2866 and sc-2855.
CD94 (HP-3D9) PE: sc-19634 PE. FCM analysis of human peripheral blood leukocytes. Quadrant markers were set based on the isotype control, normal mouse IgG1: sc-2866.
CD8 (HIT8a) PE: sc-19646 PE. FCM analysis of human peripheral blood leukocytes. Quadrant markers were set based on the isotype control, normal mouse IgG1: sc-2866.
Integrin αM (2LPM19c) PE: sc-20050 PE. FCM analysis of human peripheral blood leukocytes. Black line histogram represents the isotype control, normal mouse IgG1: sc-2866.
CD81 (1.3.3.22) PE: sc-7637 PE. FCM analysis of human peripheral blood leukocytes. Quadrant markers were set based on the isotype control, normal mouse IgG1: sc-2866.